General Social Characteristics, 2000 data (id:3422180, place: Ewing CDP, New Jersey)SCHOOL ENROLLMENTPopulation 3 years and over enrolled in school: 11,197 (100%)
Nursery school, preschool: 620 (5.54%)
Kindergarten: 372 (3.32%)
Elementary school (grades 1-8): 3,063 (27.36%)
High school (grades 9-12): 1,627 (14.53%)
College or graduate school: 5,515 (49.25%)
EDUCATIONAL ATTAINMENTPopulation 25 years and over: 23,114 (100%)
Less than 9th grade: 1,083 (4.69%)
9th to 12th grade, no diploma: 2,585 (11.18%)
High school graduate (includes equivalency): 6,769 (29.29%)
Some college, no degree: 4,554 (19.7%)
Associate degree: 1,401 (6.06%)
Bachelor's degree: 3,940 (17.05%)
Graduate or professional degree: 2,782 (12.04%)
Percent high school graduate or higher: 84.1%
Percent bachelor's degree or higher: 29.1%
MARITIAL STATUSPopulation 15 years and over: 30,422 (100%)
Never married: 10,816 (35.55%)
Now married, except separated: 14,584 (47.94%)
Separated: 553 (1.82%)
Total Widowed: 2,205 (7.25%)
Widowed Female: 1,827 (6.01%)
Total Divorced: 2,264 (7.44%)
Divorced Female: 1,384 (4.55%)
GRANDPARENTS AS CAREGIVERSGrandparent living in household with one or more own grandchildren under 18 years: 656 (100%)
Grandparent responsible for grandchildren: 274 (41.77%)
VETERAN STATUSCivilian population 18 years and over: 29,306 (100%)
Civilian veterans: 3,496 (11.93%)
DISABILITY STATUS OF THE CIVILIAN NONINSTITUTIONALIZED POPULATIONPopulation 5 to 20 years: 8,575 (100%)
--With a disability: 489 (5.7%)
Population 21 to 64 years: 18,591 (100%)
--With a disability: 3,017 (16.23%)
----Percent employed: 61.5%
--No disability: 15,574 (83.77%)
----Percent employed: 82%
Population 65 years and over: 5,445 (100%)
--With a disability: 1,987 (36.49%)
RESIDENCE IN 1995Population 5 years and over: 34,082 (100%)
Same house in 1995: 20,979 (61.55%)
Different house in the U.S. in 1995: 12,210 (35.83%)
--Same county: 6,866 (20.15%)
--Different county: 5,344 (15.68%)
----Same state: 3,865 (11.34%)
----Different state: 1,479 (4.34%)
Elsewhere in 1995: 893 (2.62%)
NATIVITY AND PLACE OF BIRTHTotal population: 35,707 (100%)
Native: 32,778 (91.8%)
--Born in United States: 32,304 (100%)
----State of residence: 23,775 (66.58%)
----Different state: 8,529 (23.89%)
--Born outside United States: 474 (1.33%)
Foreign born: 2,929 (8.2%)
----Entered 1990 to March 2000: 1,262 (3.53%)
--Naturalized citizen: 1,293 (3.62%)
--Not a citizen: 1,636 (4.58%)
REGION OF BIRTH OF FOREIGN BORNTotal (excluding born at sea): 2,929 (100%)
Europe: 1,085 (37.04%)
Asia: 669 (22.84%)
Africa: 187 (6.38%)
Oceania: 7 (0.24%)
Latin America: 936 (31.96%)
Northern America: 45 (1.54%)
LANGUAGE SPOKEN AT HOMEPopulation 5 years and over: 34,082 (100%)
English only: 29,634 (86.95%)
Language other than English: 4,448 (13.05%)
----Speak English less than "very well": 1,763 (5.17%)
--Spanish: 1,391 (4.08%)
----Speak English less than "very well": 560 (1.64%)
--Other Indo-European languages: 2,478 (7.27%)
----Speak English less than "very well": 941 (2.76%)
--Asian and Pacific Island languages: 318 (0.93%)
----Speak English less than "very well": 161 (0.47%)
ANCESTRY (single or multiple)Total population: 35,707 (100%)
Total ancestries reported: 41,663% (116.68%)
Arab: 147 (0.41%)
Czech: 315 (0.88%)
Danish: 61 (0.17%)
Dutch: 653 (1.83%)
English: 3,600 (10.08%)
French (except Basque): 523 (1.46%)
French Canadian: 92 (0.26%)
German: 5,016 (14.05%)
Greek: 168 (0.47%)
Hungarian: 763 (2.14%)
Irish: 5,501 (15.41%)
Italian: 5,955 (16.68%)
Lithuanian: 194 (0.54%)
Norwegian: 174 (0.49%)
Polish: 3,091 (8.66%)
Portuguese: 30 (0.08%)
Russian: 692 (1.94%)
Scotch-Irish: 531 (1.49%)
Scottish: 670 (1.88%)
Slovak: 397 (1.11%)
Subsaharan African: 364 (1.02%)
Swedish: 147 (0.41%)
Swiss: 34 (0.1%)
Ukrainian: 260 (0.73%)
United States or American: 1,060 (2.97%)
Welsh: 209 (0.59%)
West Indian (excluding Hispanic groups): 524 (1.47%)
Other ancestries: 10,492 (29.38%)
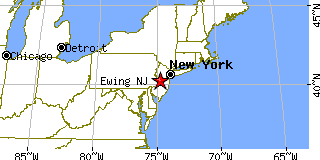
Return to Ewing,NJ.