General Social Characteristics, 2000 data (id:2442875, place: Joppatowne CDP, Maryland)SCHOOL ENROLLMENTPopulation 3 years and over enrolled in school: 2,868 (100%)
Nursery school, preschool: 207 (7.22%)
Kindergarten: 131 (4.57%)
Elementary school (grades 1-8): 1,263 (44.04%)
High school (grades 9-12): 664 (23.15%)
College or graduate school: 603 (21.03%)
EDUCATIONAL ATTAINMENTPopulation 25 years and over: 7,810 (100%)
Less than 9th grade: 262 (3.35%)
9th to 12th grade, no diploma: 935 (11.97%)
High school graduate (includes equivalency): 2,627 (33.64%)
Some college, no degree: 1,885 (24.14%)
Associate degree: 564 (7.22%)
Bachelor's degree: 962 (12.32%)
Graduate or professional degree: 575 (7.36%)
Percent high school graduate or higher: 84.7%
Percent bachelor's degree or higher: 19.7%
MARITIAL STATUSPopulation 15 years and over: 9,136 (100%)
Never married: 2,002 (21.91%)
Now married, except separated: 5,520 (60.42%)
Separated: 283 (3.1%)
Total Widowed: 503 (5.51%)
Widowed Female: 377 (4.13%)
Total Divorced: 828 (9.06%)
Divorced Female: 453 (4.96%)
GRANDPARENTS AS CAREGIVERSGrandparent living in household with one or more own grandchildren under 18 years: 164 (100%)
Grandparent responsible for grandchildren: 36 (21.95%)
VETERAN STATUSCivilian population 18 years and over: 8,584 (100%)
Civilian veterans: 1,474 (17.17%)
DISABILITY STATUS OF THE CIVILIAN NONINSTITUTIONALIZED POPULATIONPopulation 5 to 20 years: 2,370 (100%)
--With a disability: 247 (10.42%)
Population 21 to 64 years: 6,949 (100%)
--With a disability: 1,382 (19.89%)
----Percent employed: 76.2%
--No disability: 5,567 (80.11%)
----Percent employed: 81.6%
Population 65 years and over: 1,281 (100%)
--With a disability: 428 (33.41%)
RESIDENCE IN 1995Population 5 years and over: 10,626 (100%)
Same house in 1995: 6,313 (59.41%)
Different house in the U.S. in 1995: 4,101 (38.59%)
--Same county: 1,952 (18.37%)
--Different county: 2,149 (20.22%)
----Same state: 1,672 (15.73%)
----Different state: 477 (4.49%)
Elsewhere in 1995: 212 (2%)
NATIVITY AND PLACE OF BIRTHTotal population: 11,316 (100%)
Native: 10,745 (94.95%)
--Born in United States: 10,619 (100%)
----State of residence: 7,288 (64.4%)
----Different state: 3,331 (29.44%)
--Born outside United States: 126 (1.11%)
Foreign born: 571 (5.05%)
----Entered 1990 to March 2000: 274 (2.42%)
--Naturalized citizen: 333 (2.94%)
--Not a citizen: 238 (2.1%)
REGION OF BIRTH OF FOREIGN BORNTotal (excluding born at sea): 571 (100%)
Europe: 288 (50.44%)
Asia: 110 (19.26%)
Africa: 28 (4.9%)
Oceania: 0 (0%)
Latin America: 109 (19.09%)
Northern America: 36 (6.3%)
LANGUAGE SPOKEN AT HOMEPopulation 5 years and over: 10,626 (100%)
English only: 9,874 (92.92%)
Language other than English: 752 (7.08%)
----Speak English less than "very well": 325 (3.06%)
--Spanish: 295 (2.78%)
----Speak English less than "very well": 135 (1.27%)
--Other Indo-European languages: 319 (3%)
----Speak English less than "very well": 93 (0.88%)
--Asian and Pacific Island languages: 117 (1.1%)
----Speak English less than "very well": 88 (0.83%)
ANCESTRY (single or multiple)Total population: 11,316 (100%)
Total ancestries reported: 12,878% (113.8%)
Arab: 45 (0.4%)
Czech: 162 (1.43%)
Danish: 17 (0.15%)
Dutch: 154 (1.36%)
English: 1,458 (12.88%)
French (except Basque): 299 (2.64%)
French Canadian: 15 (0.13%)
German: 3,008 (26.58%)
Greek: 143 (1.26%)
Hungarian: 36 (0.32%)
Irish: 1,981 (17.51%)
Italian: 862 (7.62%)
Lithuanian: 9 (0.08%)
Norwegian: 111 (0.98%)
Polish: 984 (8.7%)
Portuguese: 14 (0.12%)
Russian: 98 (0.87%)
Scotch-Irish: 190 (1.68%)
Scottish: 156 (1.38%)
Slovak: 0 (0%)
Subsaharan African: 28 (0.25%)
Swedish: 18 (0.16%)
Swiss: 38 (0.34%)
Ukrainian: 43 (0.38%)
United States or American: 375 (3.31%)
Welsh: 113 (1%)
West Indian (excluding Hispanic groups): 54 (0.48%)
Other ancestries: 2,467 (21.8%)
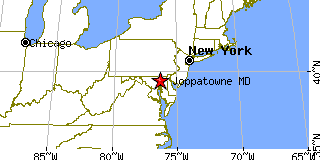
Return to Joppatowne,MD.