General Demographic Characteristics, 2000 data (id:4849320, place: Moran city, Texas)Total Population: 233Male: 110 (47.21%)
Female: 123 (52.79%)
Population data by age, 2000 dataUnder 5 years: 10 (4.29%)
5 to 9 years: 16 (6.87%)
10 to 14 years: 14 (6.01%)
15 to 19 years: 19 (8.15%)
20 to 24 years: 8 (3.43%)
25 to 34 years: 23 (9.87%)
35 to 44 years: 32 (13.73%)
45 to 54 years: 38 (16.31%)
55 to 59 years: 12 (5.15%)
60 to 64 years: 12 (5.15%)
65 to 74 years: 30 (12.88%)
75 to 84 years: 13 (5.58%)
85 years and over: 6 (2.58%)
Median age: 43.4 yearsPopulation data by age, legal ages, 2000 data18 years and over: 180 (77.25%)
21 years and over: 172 (73.82%)
62 years and over: 58 (24.89%)
65 years and over: 49 (21.03%)
18 years and older by gender, 2000 data18 years and over: 180 (77.25%)
--Male: 84 (36.05%)
--Female: 96 (41.2%)
65 years and older by gender, 2000 data65 years and over: 49 (21.03%)
--Male: 20 (8.58%)
--Female: 29 (12.45%)
Races, 2000 dataOne Race: 231 (99.14%)
--White: 221 (94.85%)
--Hispanic or Latino (of any race): 11 (4.72%)
--Black or African American: 0 (0%)
--American Indian and Alaska Native: 0 (0%)
--Asian: 0 (0%)
----Asian Indian: 0 (0%)
----Chinese: 0 (0%)
----Filipino: 0 (0%)
----Japanese: 0 (0%)
----Korean: 0 (0%)
----Vietnamese: 0 (0%)
----Other Asian: 0 (0%)
--Native Hawaiian and Other Pacific Islander: 0 (0%)
----Native Hawaiian: 0 (0%)
----Guamanian or Chamorro: 0 (0%)
----Samoan: 0 (0%)
----Other Pacific Islander: 0 (0%)
--Some other race: 2 (0.86%)
Two or more Races: 2 (0.86%)
Hispanic or Latino Races, 2000 dataHispanic or Latino (of any race): 11 (4.72%)
--Mexican: 10 (4.29%)
--Puerto Rican: 0 (0%)
--Cuban: 0 (0%)
--Other Hispanic or Latino: 1 (0.43%)
Not Hispanic or Latino: 222 (95.28%)
--White Alone: 221 (94.85%)
Housedold Data, 2000 dataHousehold population: 233 (100%)
--Householder: 97 (41.63%)
--Spouse: 53 (22.75%)
--Child: 68 (29.18%)
----Child with own child under 18 years: 49 (21.03%)
--Other relatives: 8 (3.43%)
----Other relatives under 18 years: 4 (1.72%)
--Nonrelatives: 7 (3%)
----Unmarried partner: 1 (0.43%)
Living in group quarters: 0 (0%)
--Institutionalized Population: 0 (0%)
--Non Institutionalized Population: 0 (0%)
Total households: 97Family households (families): 68 (70.1%)
----With own children under 18 years: 24 (24.74%)
--Married-couple families: 53 (54.64%)
----With own children under 18 years: 18 (18.56%)
--Female householder, no husband present: 11 (11.34%)
----With own children under 18 years: 5 (5.15%)
Nonfamily households: 29 (29.9%)
--Householder living alone: 29 (29.9%)
----Householder 65 years and over: 15 (15.46%)
Households with one or more people under 18 years: 27 (27.84%)
Households with one or more people 65 years and over: 37 (38.14%)
Average household size: 2.4 people
Average family size: 2.9 people
Housing Units, 2000 dataTotal housing units: 146
Occupied housing units: 97 (66.44%)
Vacant housing units: 49 (33.56%)
--For seasonal, occasional, or recreational use: 8 (5.48%)
Home owner vacancy rate (percent): 5%
Rental vacancy rate (percent): 40%
Occupied housing units: 97 (66.44%)
Owner occupied housing units: 76 (52.05%)
Renter occupied housing units: 21 (14.38%)
Average household size of owner occupied units: 2.36 people
Average household size of renter occupied units: 2.57 people
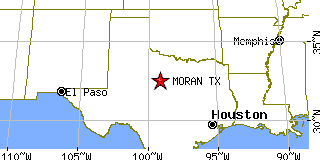
Return to Moran,TX.