General Demographic Characteristics, 2000 data (id:1712567, place: Charleston city, Illinois)Total Population: 21,039Male: 9,781 (46.49%)
Female: 11,258 (53.51%)
Population data by age, 2000 dataUnder 5 years: 794 (3.77%)
5 to 9 years: 771 (3.66%)
10 to 14 years: 808 (3.84%)
15 to 19 years: 3,088 (14.68%)
20 to 24 years: 6,715 (31.92%)
25 to 34 years: 2,024 (9.62%)
35 to 44 years: 1,911 (9.08%)
45 to 54 years: 1,784 (8.48%)
55 to 59 years: 600 (2.85%)
60 to 64 years: 506 (2.41%)
65 to 74 years: 921 (4.38%)
75 to 84 years: 817 (3.88%)
85 years and over: 300 (1.43%)
Median age: 22.7 yearsPopulation data by age, legal ages, 2000 data18 years and over: 18,141 (86.23%)
21 years and over: 13,625 (64.76%)
62 years and over: 2,315 (11%)
65 years and over: 2,038 (9.69%)
18 years and older by gender, 2000 data18 years and over: 18,141 (86.23%)
--Male: 8,310 (39.5%)
--Female: 9,831 (46.73%)
65 years and older by gender, 2000 data65 years and over: 2,038 (9.69%)
--Male: 780 (3.71%)
--Female: 1,258 (5.98%)
Races, 2000 dataOne Race: 20,812 (98.92%)
--White: 19,252 (91.51%)
--Hispanic or Latino (of any race): 370 (1.76%)
--Black or African American: 894 (4.25%)
--American Indian and Alaska Native: 51 (0.24%)
--Asian: 282 (1.34%)
----Asian Indian: 55 (0.26%)
----Chinese: 76 (0.36%)
----Filipino: 26 (0.12%)
----Japanese: 38 (0.18%)
----Korean: 32 (0.15%)
----Vietnamese: 10 (0.05%)
----Other Asian: 45 (0.21%)
--Native Hawaiian and Other Pacific Islander: 18 (0.09%)
----Native Hawaiian: 2 (0.01%)
----Guamanian or Chamorro: 2 (0.01%)
----Samoan: 1 (0%)
----Other Pacific Islander: 13 (0.06%)
--Some other race: 105 (0.5%)
Two or more Races: 227 (1.08%)
Hispanic or Latino Races, 2000 dataHispanic or Latino (of any race): 370 (1.76%)
--Mexican: 229 (1.09%)
--Puerto Rican: 38 (0.18%)
--Cuban: 22 (0.1%)
--Other Hispanic or Latino: 81 (0.38%)
Not Hispanic or Latino: 20,669 (98.24%)
--White Alone: 19,252 (91.51%)
Housedold Data, 2000 dataHousehold population: 17,068 (81.13%)
--Householder: 7,672 (36.47%)
--Spouse: 2,598 (12.35%)
--Child: 3,292 (15.65%)
----Child with own child under 18 years: 2,691 (12.79%)
--Other relatives: 359 (1.71%)
----Other relatives under 18 years: 121 (0.58%)
--Nonrelatives: 3,147 (14.96%)
----Unmarried partner: 322 (1.53%)
Living in group quarters: 3,971 (18.87%)
--Institutionalized Population: 387 (1.84%)
--Non Institutionalized Population: 3,584 (17.04%)
Total households: 7,672Family households (families): 3,326 (43.35%)
----With own children under 18 years: 1,548 (20.18%)
--Married-couple families: 2,598 (33.86%)
----With own children under 18 years: 1,107 (14.43%)
--Female householder, no husband present: 559 (7.29%)
----With own children under 18 years: 360 (4.69%)
Nonfamily households: 4,346 (56.65%)
--Householder living alone: 2,658 (34.65%)
----Householder 65 years and over: 727 (9.48%)
Households with one or more people under 18 years: 1,647 (21.47%)
Households with one or more people 65 years and over: 1,398 (18.22%)
Average household size: 2.22 people
Average family size: 2.88 people
Housing Units, 2000 dataTotal housing units: 8,148
Occupied housing units: 7,672 (94.16%)
Vacant housing units: 476 (5.84%)
--For seasonal, occasional, or recreational use: 14 (0.17%)
Home owner vacancy rate (percent): 2.3%
Rental vacancy rate (percent): 5%
Occupied housing units: 7,672 (94.16%)
Owner occupied housing units: 3,508 (43.05%)
Renter occupied housing units: 4,164 (51.1%)
Average household size of owner occupied units: 2.42 people
Average household size of renter occupied units: 2.06 people
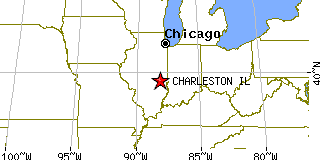
Return to Charleston,IL.