General Social Characteristics, 2000 data (id:2639360, place: Houghton city, Michigan)SCHOOL ENROLLMENTPopulation 3 years and over enrolled in school: 4,787 (100%)
Nursery school, preschool: 33 (0.69%)
Kindergarten: 27 (0.56%)
Elementary school (grades 1-8): 442 (9.23%)
High school (grades 9-12): 259 (5.41%)
College or graduate school: 4,026 (84.1%)
EDUCATIONAL ATTAINMENTPopulation 25 years and over: 2,234 (100%)
Less than 9th grade: 58 (2.6%)
9th to 12th grade, no diploma: 116 (5.19%)
High school graduate (includes equivalency): 429 (19.2%)
Some college, no degree: 422 (18.89%)
Associate degree: 192 (8.59%)
Bachelor's degree: 448 (20.05%)
Graduate or professional degree: 569 (25.47%)
Percent high school graduate or higher: 92.2%
Percent bachelor's degree or higher: 45.5%
MARITIAL STATUSPopulation 15 years and over: 6,382 (100%)
Never married: 4,286 (67.16%)
Now married, except separated: 1,610 (25.23%)
Separated: 19 (0.3%)
Total Widowed: 275 (4.31%)
Widowed Female: 237 (3.71%)
Total Divorced: 192 (3.01%)
Divorced Female: 152 (2.38%)
GRANDPARENTS AS CAREGIVERSGrandparent living in household with one or more own grandchildren under 18 years: 0
Grandparent responsible for grandchildren: 0
VETERAN STATUSCivilian population 18 years and over: 6,154 (100%)
Civilian veterans: 215 (3.49%)
DISABILITY STATUS OF THE CIVILIAN NONINSTITUTIONALIZED POPULATIONPopulation 5 to 20 years: 2,762 (100%)
--With a disability: 162 (5.87%)
Population 21 to 64 years: 3,611 (100%)
--With a disability: 303 (8.39%)
----Percent employed: 45.2%
--No disability: 3,308 (91.61%)
----Percent employed: 59.4%
Population 65 years and over: 483 (100%)
--With a disability: 202 (41.82%)
RESIDENCE IN 1995Population 5 years and over: 6,877 (100%)
Same house in 1995: 1,805 (26.25%)
Different house in the U.S. in 1995: 4,729 (68.77%)
--Same county: 830 (12.07%)
--Different county: 3,899 (56.7%)
----Same state: 2,950 (42.9%)
----Different state: 949 (13.8%)
Elsewhere in 1995: 343 (4.99%)
NATIVITY AND PLACE OF BIRTHTotal population: 7,025 (100%)
Native: 6,435 (91.6%)
--Born in United States: 6,358 (100%)
----State of residence: 4,540 (64.63%)
----Different state: 1,818 (25.88%)
--Born outside United States: 77 (1.1%)
Foreign born: 590 (8.4%)
----Entered 1990 to March 2000: 459 (6.53%)
--Naturalized citizen: 146 (2.08%)
--Not a citizen: 444 (6.32%)
REGION OF BIRTH OF FOREIGN BORNTotal (excluding born at sea): 590 (100%)
Europe: 53 (8.98%)
Asia: 379 (64.24%)
Africa: 86 (14.58%)
Oceania: 4 (0.68%)
Latin America: 40 (6.78%)
Northern America: 28 (4.75%)
LANGUAGE SPOKEN AT HOMEPopulation 5 years and over: 6,877 (100%)
English only: 6,107 (88.8%)
Language other than English: 770 (11.2%)
----Speak English less than "very well": 271 (3.94%)
--Spanish: 129 (1.88%)
----Speak English less than "very well": 40 (0.58%)
--Other Indo-European languages: 249 (3.62%)
----Speak English less than "very well": 35 (0.51%)
--Asian and Pacific Island languages: 235 (3.42%)
----Speak English less than "very well": 165 (2.4%)
ANCESTRY (single or multiple)Total population: 7,025 (100%)
Total ancestries reported: 8,811% (125.42%)
Arab: 57 (0.81%)
Czech: 41 (0.58%)
Danish: 90 (1.28%)
Dutch: 256 (3.64%)
English: 791 (11.26%)
French (except Basque): 436 (6.21%)
French Canadian: 86 (1.22%)
German: 1,777 (25.3%)
Greek: 10 (0.14%)
Hungarian: 82 (1.17%)
Irish: 803 (11.43%)
Italian: 378 (5.38%)
Lithuanian: 33 (0.47%)
Norwegian: 234 (3.33%)
Polish: 597 (8.5%)
Portuguese: 8 (0.11%)
Russian: 67 (0.95%)
Scotch-Irish: 74 (1.05%)
Scottish: 167 (2.38%)
Slovak: 8 (0.11%)
Subsaharan African: 153 (2.18%)
Swedish: 321 (4.57%)
Swiss: 5 (0.07%)
Ukrainian: 53 (0.75%)
United States or American: 243 (3.46%)
Welsh: 58 (0.83%)
West Indian (excluding Hispanic groups): 0 (0%)
Other ancestries: 1,983 (28.23%)
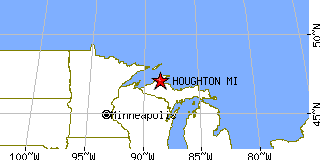
Return to Houghton,MI.