General Social Characteristics, 2000 data (id:2469350, place: St. Charles CDP, Maryland)SCHOOL ENROLLMENTPopulation 3 years and over enrolled in school: 10,605 (100%)
Nursery school, preschool: 764 (7.2%)
Kindergarten: 629 (5.93%)
Elementary school (grades 1-8): 4,971 (46.87%)
High school (grades 9-12): 2,177 (20.53%)
College or graduate school: 2,064 (19.46%)
EDUCATIONAL ATTAINMENTPopulation 25 years and over: 19,941 (100%)
Less than 9th grade: 580 (2.91%)
9th to 12th grade, no diploma: 1,805 (9.05%)
High school graduate (includes equivalency): 6,397 (32.08%)
Some college, no degree: 5,724 (28.7%)
Associate degree: 1,396 (7%)
Bachelor's degree: 2,723 (13.66%)
Graduate or professional degree: 1,316 (6.6%)
Percent high school graduate or higher: 88%
Percent bachelor's degree or higher: 20.3%
MARITIAL STATUSPopulation 15 years and over: 24,406 (100%)
Never married: 7,310 (29.95%)
Now married, except separated: 12,385 (50.75%)
Separated: 920 (3.77%)
Total Widowed: 1,167 (4.78%)
Widowed Female: 977 (4%)
Total Divorced: 2,624 (10.75%)
Divorced Female: 1,642 (6.73%)
GRANDPARENTS AS CAREGIVERSGrandparent living in household with one or more own grandchildren under 18 years: 585 (100%)
Grandparent responsible for grandchildren: 265 (45.3%)
VETERAN STATUSCivilian population 18 years and over: 21,933 (100%)
Civilian veterans: 3,733 (17.02%)
DISABILITY STATUS OF THE CIVILIAN NONINSTITUTIONALIZED POPULATIONPopulation 5 to 20 years: 9,006 (100%)
--With a disability: 496 (5.51%)
Population 21 to 64 years: 18,792 (100%)
--With a disability: 3,244 (17.26%)
----Percent employed: 62.9%
--No disability: 15,548 (82.74%)
----Percent employed: 86%
Population 65 years and over: 1,716 (100%)
--With a disability: 853 (49.71%)
RESIDENCE IN 1995Population 5 years and over: 30,597 (100%)
Same house in 1995: 15,311 (50.04%)
Different house in the U.S. in 1995: 14,523 (47.47%)
--Same county: 6,123 (20.01%)
--Different county: 8,400 (27.45%)
----Same state: 4,080 (13.33%)
----Different state: 4,320 (14.12%)
Elsewhere in 1995: 763 (2.49%)
NATIVITY AND PLACE OF BIRTHTotal population: 33,433 (100%)
Native: 32,236 (96.42%)
--Born in United States: 31,516 (100%)
----State of residence: 11,584 (34.65%)
----Different state: 19,932 (59.62%)
--Born outside United States: 720 (2.15%)
Foreign born: 1,197 (3.58%)
----Entered 1990 to March 2000: 333 (1%)
--Naturalized citizen: 608 (1.82%)
--Not a citizen: 589 (1.76%)
REGION OF BIRTH OF FOREIGN BORNTotal (excluding born at sea): 1,197 (100%)
Europe: 235 (19.63%)
Asia: 519 (43.36%)
Africa: 45 (3.76%)
Oceania: 0 (0%)
Latin America: 337 (28.15%)
Northern America: 61 (5.1%)
LANGUAGE SPOKEN AT HOMEPopulation 5 years and over: 30,597 (100%)
English only: 28,824 (94.21%)
Language other than English: 1,773 (5.79%)
----Speak English less than "very well": 572 (1.87%)
--Spanish: 781 (2.55%)
----Speak English less than "very well": 234 (0.76%)
--Other Indo-European languages: 409 (1.34%)
----Speak English less than "very well": 68 (0.22%)
--Asian and Pacific Island languages: 461 (1.51%)
----Speak English less than "very well": 249 (0.81%)
ANCESTRY (single or multiple)Total population: 33,433 (100%)
Total ancestries reported: 35,844% (107.21%)
Arab: 156 (0.47%)
Czech: 105 (0.31%)
Danish: 20 (0.06%)
Dutch: 322 (0.96%)
English: 3,552 (10.62%)
French (except Basque): 844 (2.52%)
French Canadian: 121 (0.36%)
German: 4,850 (14.51%)
Greek: 200 (0.6%)
Hungarian: 174 (0.52%)
Irish: 4,792 (14.33%)
Italian: 2,157 (6.45%)
Lithuanian: 96 (0.29%)
Norwegian: 326 (0.98%)
Polish: 972 (2.91%)
Portuguese: 79 (0.24%)
Russian: 126 (0.38%)
Scotch-Irish: 642 (1.92%)
Scottish: 577 (1.73%)
Slovak: 116 (0.35%)
Subsaharan African: 452 (1.35%)
Swedish: 289 (0.86%)
Swiss: 7 (0.02%)
Ukrainian: 87 (0.26%)
United States or American: 1,739 (5.2%)
Welsh: 123 (0.37%)
West Indian (excluding Hispanic groups): 176 (0.53%)
Other ancestries: 12,744 (38.12%)
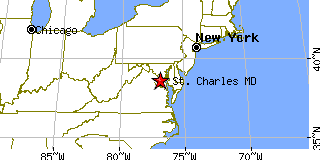
Return to St. Charles,MD.