General Social Characteristics, 2000 data (id:1905680, place: Belmond city, Iowa)SCHOOL ENROLLMENTPopulation 3 years and over enrolled in school: 544 (100%)
Nursery school, preschool: 32 (5.88%)
Kindergarten: 48 (8.82%)
Elementary school (grades 1-8): 249 (45.77%)
High school (grades 9-12): 163 (29.96%)
College or graduate school: 52 (9.56%)
EDUCATIONAL ATTAINMENTPopulation 25 years and over: 1,771 (100%)
Less than 9th grade: 189 (10.67%)
9th to 12th grade, no diploma: 124 (7%)
High school graduate (includes equivalency): 665 (37.55%)
Some college, no degree: 432 (24.39%)
Associate degree: 139 (7.85%)
Bachelor's degree: 175 (9.88%)
Graduate or professional degree: 47 (2.65%)
Percent high school graduate or higher: 82.3%
Percent bachelor's degree or higher: 12.5%
MARITIAL STATUSPopulation 15 years and over: 2,104 (100%)
Never married: 428 (20.34%)
Now married, except separated: 1,190 (56.56%)
Separated: 11 (0.52%)
Total Widowed: 289 (13.74%)
Widowed Female: 271 (12.88%)
Total Divorced: 186 (8.84%)
Divorced Female: 108 (5.13%)
GRANDPARENTS AS CAREGIVERSGrandparent living in household with one or more own grandchildren under 18 years: 14 (100%)
Grandparent responsible for grandchildren: 0 (0%)
VETERAN STATUSCivilian population 18 years and over: 1,985 (100%)
Civilian veterans: 223 (11.23%)
DISABILITY STATUS OF THE CIVILIAN NONINSTITUTIONALIZED POPULATIONPopulation 5 to 20 years: 566 (100%)
--With a disability: 47 (8.3%)
Population 21 to 64 years: 1,233 (100%)
--With a disability: 170 (13.79%)
----Percent employed: 80%
--No disability: 1,063 (86.21%)
----Percent employed: 86.5%
Population 65 years and over: 560 (100%)
--With a disability: 195 (34.82%)
RESIDENCE IN 1995Population 5 years and over: 2,435 (100%)
Same house in 1995: 1,533 (62.96%)
Different house in the U.S. in 1995: 844 (34.66%)
--Same county: 482 (19.79%)
--Different county: 362 (14.87%)
----Same state: 294 (12.07%)
----Different state: 68 (2.79%)
Elsewhere in 1995: 58 (2.38%)
NATIVITY AND PLACE OF BIRTHTotal population: 2,547 (100%)
Native: 2,411 (94.66%)
--Born in United States: 2,411 (100%)
----State of residence: 2,140 (84.02%)
----Different state: 271 (10.64%)
--Born outside United States: 0 (0%)
Foreign born: 136 (5.34%)
----Entered 1990 to March 2000: 114 (4.48%)
--Naturalized citizen: 35 (1.37%)
--Not a citizen: 101 (3.97%)
REGION OF BIRTH OF FOREIGN BORNTotal (excluding born at sea): 136 (100%)
Europe: 22 (16.18%)
Asia: 7 (5.15%)
Africa: 0 (0%)
Oceania: 0 (0%)
Latin America: 107 (78.68%)
Northern America: 0 (0%)
LANGUAGE SPOKEN AT HOMEPopulation 5 years and over: 2,435 (100%)
English only: 2,273 (93.35%)
Language other than English: 162 (6.65%)
----Speak English less than "very well": 98 (4.02%)
--Spanish: 138 (5.67%)
----Speak English less than "very well": 98 (4.02%)
--Other Indo-European languages: 24 (0.99%)
----Speak English less than "very well": 0 (0%)
--Asian and Pacific Island languages: 0 (0%)
----Speak English less than "very well": 0 (0%)
ANCESTRY (single or multiple)Total population: 2,547 (100%)
Total ancestries reported: 2,790% (109.54%)
Arab: 0 (0%)
Czech: 35 (1.37%)
Danish: 96 (3.77%)
Dutch: 99 (3.89%)
English: 222 (8.72%)
French (except Basque): 49 (1.92%)
French Canadian: 4 (0.16%)
German: 1,003 (39.38%)
Greek: 0 (0%)
Hungarian: 0 (0%)
Irish: 202 (7.93%)
Italian: 29 (1.14%)
Lithuanian: 0 (0%)
Norwegian: 538 (21.12%)
Polish: 10 (0.39%)
Portuguese: 0 (0%)
Russian: 25 (0.98%)
Scotch-Irish: 18 (0.71%)
Scottish: 16 (0.63%)
Slovak: 0 (0%)
Subsaharan African: 4 (0.16%)
Swedish: 41 (1.61%)
Swiss: 7 (0.27%)
Ukrainian: 0 (0%)
United States or American: 160 (6.28%)
Welsh: 20 (0.79%)
West Indian (excluding Hispanic groups): 0 (0%)
Other ancestries: 212 (8.32%)
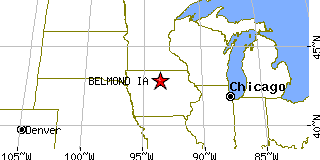
Return to Belmond,IA.