General Social Characteristics, 2000 data (id:1209000, place: Brownsville CDP, Florida)SCHOOL ENROLLMENTPopulation 3 years and over enrolled in school: 5,129 (100%)
Nursery school, preschool: 342 (6.67%)
Kindergarten: 351 (6.84%)
Elementary school (grades 1-8): 2,584 (50.38%)
High school (grades 9-12): 1,266 (24.68%)
College or graduate school: 586 (11.43%)
EDUCATIONAL ATTAINMENTPopulation 25 years and over: 7,962 (100%)
Less than 9th grade: 1,224 (15.37%)
9th to 12th grade, no diploma: 2,495 (31.34%)
High school graduate (includes equivalency): 2,546 (31.98%)
Some college, no degree: 1,043 (13.1%)
Associate degree: 255 (3.2%)
Bachelor's degree: 223 (2.8%)
Graduate or professional degree: 176 (2.21%)
Percent high school graduate or higher: 53.3%
Percent bachelor's degree or higher: 5%
MARITIAL STATUSPopulation 15 years and over: 10,195 (100%)
Never married: 4,934 (48.4%)
Now married, except separated: 2,150 (21.09%)
Separated: 631 (6.19%)
Total Widowed: 1,091 (10.7%)
Widowed Female: 914 (8.97%)
Total Divorced: 1,389 (13.62%)
Divorced Female: 759 (7.44%)
GRANDPARENTS AS CAREGIVERSGrandparent living in household with one or more own grandchildren under 18 years: 847 (100%)
Grandparent responsible for grandchildren: 499 (58.91%)
VETERAN STATUSCivilian population 18 years and over: 9,407 (100%)
Civilian veterans: 643 (6.84%)
DISABILITY STATUS OF THE CIVILIAN NONINSTITUTIONALIZED POPULATIONPopulation 5 to 20 years: 4,614 (100%)
--With a disability: 580 (12.57%)
Population 21 to 64 years: 6,862 (100%)
--With a disability: 2,616 (38.12%)
----Percent employed: 42.9%
--No disability: 4,246 (61.88%)
----Percent employed: 52.2%
Population 65 years and over: 1,782 (100%)
--With a disability: 1,125 (63.13%)
RESIDENCE IN 1995Population 5 years and over: 13,301 (100%)
Same house in 1995: 7,793 (58.59%)
Different house in the U.S. in 1995: 5,243 (39.42%)
--Same county: 4,859 (36.53%)
--Different county: 384 (2.89%)
----Same state: 165 (1.24%)
----Different state: 219 (1.65%)
Elsewhere in 1995: 265 (1.99%)
NATIVITY AND PLACE OF BIRTHTotal population: 14,453 (100%)
Native: 13,057 (90.34%)
--Born in United States: 12,913 (100%)
----State of residence: 10,372 (71.76%)
----Different state: 2,541 (17.58%)
--Born outside United States: 144 (1%)
Foreign born: 1,396 (9.66%)
----Entered 1990 to March 2000: 490 (3.39%)
--Naturalized citizen: 553 (3.83%)
--Not a citizen: 843 (5.83%)
REGION OF BIRTH OF FOREIGN BORNTotal (excluding born at sea): 1,396 (100%)
Europe: 25 (1.79%)
Asia: 54 (3.87%)
Africa: 0 (0%)
Oceania: 0 (0%)
Latin America: 1,317 (94.34%)
Northern America: 0 (0%)
LANGUAGE SPOKEN AT HOMEPopulation 5 years and over: 13,301 (100%)
English only: 11,705 (88%)
Language other than English: 1,596 (12%)
----Speak English less than "very well": 827 (6.22%)
--Spanish: 1,340 (10.07%)
----Speak English less than "very well": 732 (5.5%)
--Other Indo-European languages: 231 (1.74%)
----Speak English less than "very well": 81 (0.61%)
--Asian and Pacific Island languages: 25 (0.19%)
----Speak English less than "very well": 14 (0.11%)
ANCESTRY (single or multiple)Total population: 14,453 (100%)
Total ancestries reported: 12,305% (85.14%)
Arab: 0 (0%)
Czech: 0 (0%)
Danish: 0 (0%)
Dutch: 0 (0%)
English: 16 (0.11%)
French (except Basque): 0 (0%)
French Canadian: 0 (0%)
German: 3 (0.02%)
Greek: 0 (0%)
Hungarian: 0 (0%)
Irish: 5 (0.03%)
Italian: 21 (0.15%)
Lithuanian: 0 (0%)
Norwegian: 3 (0.02%)
Polish: 8 (0.06%)
Portuguese: 0 (0%)
Russian: 23 (0.16%)
Scotch-Irish: 6 (0.04%)
Scottish: 0 (0%)
Slovak: 0 (0%)
Subsaharan African: 307 (2.12%)
Swedish: 0 (0%)
Swiss: 0 (0%)
Ukrainian: 0 (0%)
United States or American: 550 (3.81%)
Welsh: 0 (0%)
West Indian (excluding Hispanic groups): 544 (3.76%)
Other ancestries: 10,819 (74.86%)
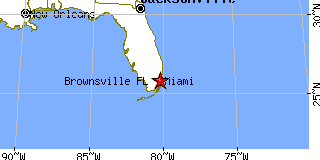
Return to Brownsville,FL.