General Demographic Characteristics, 2000 data (id:1722164, place: East Peoria city, Illinois)Total Population: 22,638Male: 10,921 (48.24%)
Female: 11,717 (51.76%)
Population data by age, 2000 dataUnder 5 years: 1,299 (5.74%)
5 to 9 years: 1,411 (6.23%)
10 to 14 years: 1,451 (6.41%)
15 to 19 years: 1,474 (6.51%)
20 to 24 years: 1,203 (5.31%)
25 to 34 years: 2,874 (12.7%)
35 to 44 years: 3,456 (15.27%)
45 to 54 years: 3,342 (14.76%)
55 to 59 years: 1,194 (5.27%)
60 to 64 years: 1,026 (4.53%)
65 to 74 years: 2,017 (8.91%)
75 to 84 years: 1,342 (5.93%)
85 years and over: 549 (2.43%)
Median age: 39.7 yearsPopulation data by age, legal ages, 2000 data18 years and over: 17,571 (77.62%)
21 years and over: 16,765 (74.06%)
62 years and over: 4,539 (20.05%)
65 years and over: 3,908 (17.26%)
18 years and older by gender, 2000 data18 years and over: 17,571 (77.62%)
--Male: 8,336 (36.82%)
--Female: 9,235 (40.79%)
65 years and older by gender, 2000 data65 years and over: 3,908 (17.26%)
--Male: 1,597 (7.05%)
--Female: 2,311 (10.21%)
Races, 2000 dataOne Race: 22,444 (99.14%)
--White: 21,867 (96.59%)
--Hispanic or Latino (of any race): 293 (1.29%)
--Black or African American: 106 (0.47%)
--American Indian and Alaska Native: 55 (0.24%)
--Asian: 150 (0.66%)
----Asian Indian: 23 (0.1%)
----Chinese: 22 (0.1%)
----Filipino: 25 (0.11%)
----Japanese: 8 (0.04%)
----Korean: 24 (0.11%)
----Vietnamese: 30 (0.13%)
----Other Asian: 18 (0.08%)
--Native Hawaiian and Other Pacific Islander: 2 (0.01%)
----Native Hawaiian: 0 (0%)
----Guamanian or Chamorro: 1 (0%)
----Samoan: 1 (0%)
----Other Pacific Islander: 0 (0%)
--Some other race: 100 (0.44%)
Two or more Races: 194 (0.86%)
Hispanic or Latino Races, 2000 dataHispanic or Latino (of any race): 293 (1.29%)
--Mexican: 194 (0.86%)
--Puerto Rican: 21 (0.09%)
--Cuban: 2 (0.01%)
--Other Hispanic or Latino: 76 (0.34%)
Not Hispanic or Latino: 22,345 (98.71%)
--White Alone: 21,867 (96.59%)
Housedold Data, 2000 dataHousehold population: 22,308 (98.54%)
--Householder: 9,478 (41.87%)
--Spouse: 5,180 (22.88%)
--Child: 6,065 (26.79%)
----Child with own child under 18 years: 4,617 (20.39%)
--Other relatives: 692 (3.06%)
----Other relatives under 18 years: 312 (1.38%)
--Nonrelatives: 893 (3.94%)
----Unmarried partner: 468 (2.07%)
Living in group quarters: 330 (1.46%)
--Institutionalized Population: 266 (1.18%)
--Non Institutionalized Population: 64 (0.28%)
Total households: 9,478Family households (families): 6,396 (67.48%)
----With own children under 18 years: 2,660 (28.06%)
--Married-couple families: 5,180 (54.65%)
----With own children under 18 years: 1,924 (20.3%)
--Female householder, no husband present: 873 (9.21%)
----With own children under 18 years: 553 (5.83%)
Nonfamily households: 3,082 (32.52%)
--Householder living alone: 2,671 (28.18%)
----Householder 65 years and over: 1,219 (12.86%)
Households with one or more people under 18 years: 2,901 (30.61%)
Households with one or more people 65 years and over: 2,702 (28.51%)
Average household size: 2.35 people
Average family size: 2.87 people
Housing Units, 2000 dataTotal housing units: 9,938
Occupied housing units: 9,478 (95.37%)
Vacant housing units: 460 (4.63%)
--For seasonal, occasional, or recreational use: 24 (0.24%)
Home owner vacancy rate (percent): 1.3%
Rental vacancy rate (percent): 7.7%
Occupied housing units: 9,478 (95.37%)
Owner occupied housing units: 6,919 (69.62%)
Renter occupied housing units: 2,559 (25.75%)
Average household size of owner occupied units: 2.5 people
Average household size of renter occupied units: 1.95 people
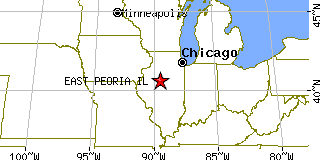
Return to East Peoria,IL.