General Housing Characteristics, 2000 data (id:1729392, place: Girard city, Illinois)Total housing units: 917UNITS IN STRUCTURE1-unit, detached: 628 (68.48%)
1-unit, attached: 21 (2.29%)
2 units: 26 (2.84%)
3 or 4 units: 71 (7.74%)
5 to 9 units: 18 (1.96%)
10 to 19 units: 0 (0%)
20 or more units: 0 (0%)
Mobile home.: 150 (16.36%)
Boat, RV, van, etc: 3 (0.33%)
YEAR STRUCTURE BUILT1999 to March 2000: 3 (0.33%)
1995 to 1998: 56 (6.11%)
1990 to 1994: 16 (1.74%)
1980 to 1989: 84 (9.16%)
1970 to 1979: 136 (14.83%)
1960 to 1969: 105 (11.45%)
1940 to 1959: 152 (16.58%)
1939 or earlier: 365 (39.8%)
ROOMS1 room: 0 (0%)
2 rooms: 5 (0.55%)
3 rooms: 71 (7.74%)
4 rooms: 225 (24.54%)
5 rooms: 187 (20.39%)
6 rooms: 194 (21.16%)
7 rooms: 89 (9.71%)
8 rooms: 82 (8.94%)
9 or more rooms: 64 (6.98%)
Median (rooms): 5.3
Occupied housing units: 865YEAR HOUSEHOLDER MOVED INTO UNIT1999 to March 2000: 176 (20.35%)
1995 to 1998: 206 (23.82%)
1990 to 1994: 159 (18.38%)
1980 to 1989: 147 (16.99%)
1970 to 1979: 104 (12.02%)
1969 or earlier: 73 (8.44%)
VEHICLES AVAILABLENone: 98 (11.33%)
1: 323 (37.34%)
2: 311 (35.95%)
3 or more: 133 (15.38%)
HOUSE HEATING FUELUtility gas: 707 (81.73%)
Bottled, tank, or LP gas: 9 (1.04%)
Electricity: 117 (13.53%)
Fuel oil, kerosene, etc: 20 (2.31%)
Coal or coke: 0 (0%)
Wood: 12 (1.39%)
Solar energy: 0 (0%)
Other fuel: 0 (0%)
No fuel used: 0 (0%)
SELECTED HOUSE CHARACTERISTICSLacking complete plumbing facilities: 0 (0%)
Lacking complete kitchen facilities: 3 (0.35%)
No telephone service: 101 (11.68%)
OCCUPANTS PER ROOMOccupied housing units: 865 (100%)
1.00 or less: 861 (99.54%)
1.01 to 1.50: 4 (0.46%)
1.51 or more: 0 (0%)
Specified owner-occupied units: 493HOUSE VALUELess than $50,000: 118 (23.94%)
$50,000 to $99,999: 316 (64.1%)
$100,000 to $149,999: 49 (9.94%)
$150,000 to $199,999: 7 (1.42%)
$200,000 to $299,999: 3 (0.61%)
$300,000 to $499,999: 0 (0%)
$500,000 to $999,999: 0 (0%)
$1,000,000 or more: 0 (0%)
Median (dollars): $62,900
MORTGAGE STATUS AND SELECTED MONTHLY OWNER COSTSWith a mortgage: 322 (65.31%)
--Less than $300: 0 (0%)
--$300 to $499: 26 (5.27%)
--$500 to $699: 112 (22.72%)
--$700 to $999: 114 (23.12%)
--$1,000 to $1,499: 64 (12.98%)
--$1,500 to $1,999: 6 (1.22%)
--$2,000 or more: 0 (0%)
--Median (dollars): $746
Not mortgaged: 171 (34.69%)
--Median (dollars): $242
SELECTED MONTHLY OWNER COSTS AS A PERCENTAGE OF HOUSEHOLD INCOME IN 1999Less than 15.0 percent: 180 (36.51%)
15.0 to 19.9 percent: 87 (17.65%)
20.0 to 24.9 percent: 77 (15.62%)
25.0 to 29.9 percent: 29 (5.88%)
30.0 to 34.9 percent: 40 (8.11%)
35.0 percent or more: 80 (16.23%)
Not computed: 0 (0%)
Specified renter-occupied units: 258GROSS RENTLess than $200: 40 (15.5%)
$200 to $299: 22 (8.53%)
$300 to $499: 121 (46.9%)
$500 to $749: 63 (24.42%)
$750 to $999: 5 (1.94%)
$1,000 to $1,499: 0 (0%)
$1,500 or more: 4 (1.55%)
No cash rent: 3 (1.16%)
Median (dollars): $405
GROSS RENT AS A PERCENTAGE OF HOUSEHOLD INCOME IN 1999Less than 15.0 percent.: 55 (21.32%)
15.0 to 19.9 percent: 29 (11.24%)
20.0 to 24.9 percent: 44 (17.05%)
25.0 to 29.9 percent: 31 (12.02%)
30.0 to 34.9 percent: 18 (6.98%)
35.0 percent or more: 73 (28.29%)
Not computed: 8 (3.1%)
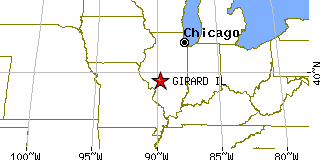
Return to Girard,IL.