General Housing Characteristics, 2000 data (id:1722164, place: East Peoria city, Illinois)Total housing units: 9,947UNITS IN STRUCTURE1-unit, detached: 8,082 (81.25%)
1-unit, attached: 82 (0.82%)
2 units: 280 (2.81%)
3 or 4 units: 334 (3.36%)
5 to 9 units: 349 (3.51%)
10 to 19 units: 322 (3.24%)
20 or more units: 402 (4.04%)
Mobile home.: 96 (0.97%)
Boat, RV, van, etc: 0 (0%)
YEAR STRUCTURE BUILT1999 to March 2000: 171 (1.72%)
1995 to 1998: 422 (4.24%)
1990 to 1994: 352 (3.54%)
1980 to 1989: 763 (7.67%)
1970 to 1979: 1,842 (18.52%)
1960 to 1969: 1,733 (17.42%)
1940 to 1959: 3,622 (36.41%)
1939 or earlier: 1,042 (10.48%)
ROOMS1 room: 139 (1.4%)
2 rooms: 427 (4.29%)
3 rooms: 794 (7.98%)
4 rooms: 1,401 (14.08%)
5 rooms: 2,304 (23.16%)
6 rooms: 1,811 (18.21%)
7 rooms: 1,443 (14.51%)
8 rooms: 856 (8.61%)
9 or more rooms: 772 (7.76%)
Median (rooms): 5.5
Occupied housing units: 9,526YEAR HOUSEHOLDER MOVED INTO UNIT1999 to March 2000: 1,370 (14.38%)
1995 to 1998: 2,286 (24%)
1990 to 1994: 1,679 (17.63%)
1980 to 1989: 1,672 (17.55%)
1970 to 1979: 1,169 (12.27%)
1969 or earlier: 1,350 (14.17%)
VEHICLES AVAILABLENone: 702 (7.37%)
1: 3,119 (32.74%)
2: 3,981 (41.79%)
3 or more: 1,724 (18.1%)
HOUSE HEATING FUELUtility gas: 8,203 (86.11%)
Bottled, tank, or LP gas: 74 (0.78%)
Electricity: 1,209 (12.69%)
Fuel oil, kerosene, etc: 8 (0.08%)
Coal or coke: 0 (0%)
Wood: 26 (0.27%)
Solar energy: 0 (0%)
Other fuel: 0 (0%)
No fuel used: 6 (0.06%)
SELECTED HOUSE CHARACTERISTICSLacking complete plumbing facilities: 20 (0.21%)
Lacking complete kitchen facilities: 29 (0.3%)
No telephone service: 186 (1.95%)
OCCUPANTS PER ROOMOccupied housing units: 9,526 (100%)
1.00 or less: 9,436 (99.06%)
1.01 to 1.50: 77 (0.81%)
1.51 or more: 13 (0.14%)
Specified owner-occupied units: 6,608HOUSE VALUELess than $50,000: 780 (11.8%)
$50,000 to $99,999: 3,287 (49.74%)
$100,000 to $149,999: 1,795 (27.16%)
$150,000 to $199,999: 492 (7.45%)
$200,000 to $299,999: 210 (3.18%)
$300,000 to $499,999: 39 (0.59%)
$500,000 to $999,999: 5 (0.08%)
$1,000,000 or more: 0 (0%)
Median (dollars): $89,900
MORTGAGE STATUS AND SELECTED MONTHLY OWNER COSTSWith a mortgage: 4,162 (62.98%)
--Less than $300: 0 (0%)
--$300 to $499: 346 (5.24%)
--$500 to $699: 829 (12.55%)
--$700 to $999: 1,445 (21.87%)
--$1,000 to $1,499: 1,171 (17.72%)
--$1,500 to $1,999: 275 (4.16%)
--$2,000 or more: 96 (1.45%)
--Median (dollars): $891
Not mortgaged: 2,446 (37.02%)
--Median (dollars): $331
SELECTED MONTHLY OWNER COSTS AS A PERCENTAGE OF HOUSEHOLD INCOME IN 1999Less than 15.0 percent: 2,799 (42.36%)
15.0 to 19.9 percent: 1,308 (19.79%)
20.0 to 24.9 percent: 911 (13.79%)
25.0 to 29.9 percent: 534 (8.08%)
30.0 to 34.9 percent: 273 (4.13%)
35.0 percent or more: 778 (11.77%)
Not computed: 5 (0.08%)
Specified renter-occupied units: 2,553GROSS RENTLess than $200: 234 (9.17%)
$200 to $299: 207 (8.11%)
$300 to $499: 1,031 (40.38%)
$500 to $749: 567 (22.21%)
$750 to $999: 121 (4.74%)
$1,000 to $1,499: 135 (5.29%)
$1,500 or more: 107 (4.19%)
No cash rent: 151 (5.91%)
Median (dollars): $448
GROSS RENT AS A PERCENTAGE OF HOUSEHOLD INCOME IN 1999Less than 15.0 percent.: 549 (21.5%)
15.0 to 19.9 percent: 387 (15.16%)
20.0 to 24.9 percent: 266 (10.42%)
25.0 to 29.9 percent: 257 (10.07%)
30.0 to 34.9 percent: 158 (6.19%)
35.0 percent or more: 716 (28.05%)
Not computed: 220 (8.62%)
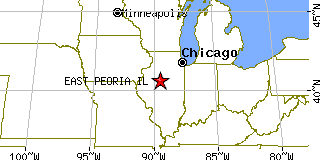
Return to East Peoria,IL.