General Economic Characteristics, 2000 data (id:4722200, place: Dyersburg city, Tennessee)EMPLOYMENT STATUSPopulation 16 years and over: 13,280 (100%)
In labor force: 8,203 (61.77%)
--Civilian labor force: 8,180 (61.6%)
----Employed: 7,477 (56.3%)
----Unemployed: 703 (5.29%)
------Percent of civilian labor force: 8.6%
--Armed Forces: 23 (0.17%)
Not in labor force: 5,077 (38.23%)
Females 16 years and over: 7,211 (54.3%)
In labor force: 3,896 (29.34%)
--Civilian labor force: 3,896 (29.34%)
----Employed: 3,528 (26.57%)
Own children under 6 years: 1,395 (10.5%)
All parents in family in labor force: 991 (7.46%)
COMMUTING TO WORKWorkers 16 years and over: 7,362 (100%)
Car, truck, or van - - drove alone: 5,996 (81.45%)
Car, truck, or van - - carpooled: 1,018 (13.83%)
Public transportation (including taxicab): 47 (0.64%)
Walked: 56 (0.76%)
Other means: 90 (1.22%)
Worked at home: 155 (2.11%)
Mean travel time to work: 16.3 minutes
OCCUPATIONEmployed civilian population 16 years and over: 7,477 (100%)
Management, professional, and related occupations: 2,015 (26.95%)
Service occupations: 1,187 (15.88%)
Sales and office occupations: 1,734 (23.19%)
Farming, fishing, and forestry occupations.: 4 (0.05%)
Construction, extraction, and maintenance occupations: 549 (7.34%)
Production, transportation, and material moving occupations: 1,988 (26.59%)
INDUSTRYAgriculture, forestry, fishing and hunting, and mining: 37 (0.49%)
Construction: 364 (4.87%)
Manufacturing: 2,060 (27.55%)
Wholesale trade.: 123 (1.65%)
Retail trade: 864 (11.56%)
Transportation and warehousing, and utilities: 282 (3.77%)
Information: 267 (3.57%)
Finance, insurance, real estate, and rental and leasing: 331 (4.43%)
Professional, scientific, management, administrative, and waste management services: 401 (5.36%)
Educational, health and social services: 1,330 (17.79%)
Arts, entertainment, recreation, accommodation and food services: 612 (8.19%)
Other services (except public administration): 442 (5.91%)
Public administration: 364 (4.87%)
CLASS OF WORKERPrivate wage and salary workers: 5,696 (76.18%)
Government workers: 1,187 (15.88%)
Self-employed workers in own not incorporated business: 561 (7.5%)
Unpaid family workers: 33 (0.44%)
INCOME IN 1999Households: 7,082 (100%)
Less than $10,000: 1,185 (16.73%)
$10,000 to $14,999: 732 (10.34%)
$15,000 to $24,999: 1,241 (17.52%)
$25,000 to $34,999: 1,056 (14.91%)
$35,000 to $49,999: 1,046 (14.77%)
$50,000 to $74,999: 1,025 (14.47%)
$75,000 to $99,999: 414 (5.85%)
$100,000 to $149,999: 248 (3.5%)
$150,000 to $199,999: 49 (0.69%)
$200,000 or more: 86 (1.21%)
Median household income: $28,232
With earnings: 5,309 (74.96%)
--Mean earnings: $40,913
With Social Security income: 1,987 (28.06%)
--Mean Social Security income: $10,446
With Supplemental Security Income: 500 (7.06%)
--Mean Supplemental Security Income: $5,879
With public assistance income: 413 (5.83%)
--Mean public assistance income: $1,988
With retirement income: 931 (13.15%)
--Mean retirement income: $11,217
Families: 4,604 (100%)
Less than $10,000: 486 (10.56%)
$10,000 to $14,999: 403 (8.75%)
$15,000 to $24,999: 738 (16.03%)
$25,000 to $34,999: 689 (14.97%)
$35,000 to $49,999: 757 (16.44%)
$50,000 to $74,999: 822 (17.85%)
$75,000 to $99,999: 380 (8.25%)
$100,000 to $149,999: 208 (4.52%)
$150,000 to $199,999: 49 (1.06%)
$200,000 or more: 72 (1.56%)
Median family income: $34,754
Per capita income: $16,388
Median earnings (dollars)Male full-time, year-round workers: $30,898
Female full-time, year-round workers: $21,337
POVERTY STATUS IN 1999Families: 800 (17.38%)
--With related children under 18 years: 674 (14.64%)
----With related children under 5 years: 407 (8.84%)
Families with female householder, no husband present: 516 (11.21%)
--With related children under 18 years: 516 (11.21%)
----With related children under 5 years: 320 (6.95%)
Individuals: 3,480 (75.59%)
--18 years and over: 2,111 (45.85%)
----65 years and over: 442 (9.6%)
--Related children under 18 years: 1,348 (29.28%)
----Related children 5 to 17 years: 897 (19.48%)
--Unrelated individuals 15 years and over: 977 (21.22%)
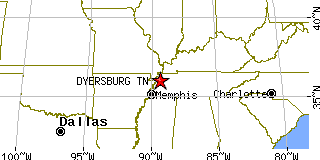
Return to Dyersburg,TN.