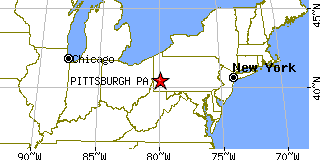
PITTSBURGH is located in ALLEGHENY county, Pennsylvania at latitude 40.441419 and longitude -79.977292. The population of PITTSBURGH is 316,718 as of the year 2005 with a population growth of -5.33% from the year 2000 through 2005. The most common zip code of PITTSBURGH is
15237.
|
|
Population 2005: 316,718
Population 2004: 320,828
Population 2003: 325,426
Population 2002: 327,547
Population 2001: 330,591
Population 2000: 334,563 (2000 Census)
Population 1990: 369,879 (1990 Census)
Population Growth 2000 to 2005: -5.33%
Population Growth 1990 to 2000: -9.55%
Population (2005 Estimate): 284,366
Male: 134,964 (47.46%)
Female: 149,402 (52.54%)
Median age: 38.40 years
Races, 2005 Data (% change from 2000):
White: 63.55% (-3.40%)
Black or African American: 28.81% (+1.69%)
Asian: 3.77% (+1.02%)
Two or more races: 1.76% (+0.15%)
Other race: 0.95% (+0.29%)
American Indian: 0.33% (+0.14%)
Housing Units: 163,366 (2000 Census)
Land Area: 55.5844 square miles
Water Area: 2.7674 square miles
Most populous zip code: 15237
|
 |

|
All zip codes:
15201, 15202, 15203, 15204, 15205, 15206, 15207, 15208, 15209, 15210, 15211, 15212, 15213, 15214, 15215, 15216, 15217, 15218, 15219, 15220, 15221, 15222, 15223, 15224, 15225, 15226, 15227, 15228, 15229, 15230, 15231, 15232, 15233, 15234, 15235, 15236, 15237, 15238, 15239, 15240, 15241, 15242, 15243, 15244, 15250, 15251, 15252, 15253, 15254, 15255, 15257, 15258, 15259, 15260, 15261, 15262, 15263, 15264, 15265, 15266, 15267, 15268, 15270, 15272, 15274, 15275, 15276, 15277, 15278, 15279, 15281, 15282, 15283, 15285, 15286, 15290, 15295(zip codes with population are shown in bold)Cities & Towns nearby Pittsburgh
Mount Oliver, PA 2.1mi SSW
Reserve Township, PA 2.6mi NNW
Millvale, PA 2.9mi N
Green Tree, PA 4.2mi WSW
Etna, PA 4.3mi NNE
Homestead, PA 4.4mi SE
Sharpsburg, PA 4.5mi NE
Dormont, PA 4.6mi SW
West Homestead, PA 4.6mi SE
Brentwood, PA 4.6mi S
Population data by age, 2005 dataUnder 5 years: 15,708 (5.52%)
5 to 9 years: 15,231 (5.36%)
10 to 14 years: 14,571 (5.12%)
15 to 19 years: 15,053 (5.29%)
20 to 24 years: 30,261 (10.64%)
25 to 34 years: 38,744 (13.62%)
35 to 44 years: 38,131 (13.41%)
45 to 54 years: 44,732 (15.73%)
55 to 59 years: 16,575 (5.83%)
60 to 64 years: 13,937 (4.90%)
65 to 74 years: 19,021 (6.69%)
75 to 84 years: 17,259 (6.07%)
85 years and over: 5,143 (1.81%)
Median age: 38.40 yearsPopulation data by age, legal ages, 2005 data18 years and over: 229,188 (80.60%)
21 years and over: 218,533 (76.85%)
62 years and over: 48,316 (16.99%)
65 years and over: 41,423 (14.57%)
18 years and older by gender, 2005 data18 years and over: 229,188 (80.60%)
Male: 107,452 (46.88% of this group)
Female: 121,736 (53.12% of this group)
65 years and older by gender, 2005 data65 years and over: 41,423 (14.57%)
Male: 15,645 (37.77% of this group)
Female: 25,778 (62.23% of this group)
Races, 2005 dataOne Race: 279,372 (98.24%)
Two or more Races: 4,994 (1.76%)
White: 180,725 (63.55%)
Hispanic or Latino (of any race): 5,018 (1.76%)
Black or African American: 81,915 (28.81%)
Asian: 10,727 (3.77%)
Native Hawaiian and Other Pacific Islander: 0 (0.00%)
American Indian and Alaska Native: 938 (0.33%)
Some other race: 2,714 (0.95%)
Hispanic or Latino Races, 2005 dataHispanic or Latino (of any race): 5,018 (1.76%)
Mexican: 1,786 (0.63%)
Puerto Rican: 1,376 (0.48%)
Cuban: 118 (0.04%)
Other Hispanic or Latino: 1,738 (0.61%)
Not Hispanic or Latino: 279,348 (98.24%)
Two or More Races, 2005 dataTwo or more Races: 4,994 (1.76%)
White and Black or African American: 2,010 (0.71%)
White and American Indian and Alaska Native: 95 (0.03%)
White and Asian: 537 (0.19%)
Black or African American and American Indian and Alaska Native: 915 (0.32%)
Two races including Some other race: 653 (0.23%)
Two races excluding Some other race, and Three or more races: 4,031 (1.42%)
Housedold Data, 2005 dataHousehold population: 284,366 (100.00%)
Householder: 139,196 (48.95%)
Spouse: 43,181 (15.19%)
Child: 68,691 (24.16%)
Other relatives: 13,654 (4.80%)
Nonrelatives: 19,644 (6.91%)
Unmarried partner: 4,878 (1.72%)
Total households: 136,309 Family households (families): 68,844 (50.51%)
With own children under 18 years: 28,290 (20.75%)
Married-couple families: 42,359 (31.08%)
With own children under 18 years: 14,356 (10.53%)
Male householder, no wife present: 5,616 (4.12%)
With own children under 18 years: 1,511 (1.11%)
Female householder, no husband present: 20,869 (15.31%)
With own children under 18 years: 12,423 (9.11%)
Nonfamily households: 67,465 (49.49%)
Householder living alone: 55,836 (40.96%)
65 years and over: 16,849 (12.36%)
Households with one or more people under 18 years: 31,146 (22.85%)
Households with one or more people 65 years and over: 32,205 (23.63%)
Average household size : 2.09
Average family size: 2.84
US Beacon Home


