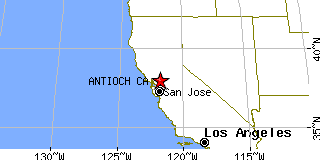
ANTIOCH is located in CONTRA COSTA county, California at latitude 37.992421 and longitude -121.802225 with an elevation of 40 feet. The population of ANTIOCH is 100,631 as of the year 2005 with a population growth of 11.16% from the year 2000 through 2005. The most common zip code of ANTIOCH is
94509.
|
|
Population 2005: 100,631
Population 2004: 100,386
Population 2003: 100,909
Population 2002: 99,489
Population 2001: 95,670
Population 2000: 90,532 (2000 Census)
Population 1990: 62,195 (1990 Census)
Population Growth 2000 to 2005: 11.16%
Population Growth 1990 to 2000: 45.56%
Population (2005 Estimate): 103,339
Male: 52,945 (51.23%)
Female: 50,394 (48.77%)
Median age: 30.40 years
Races, 2005 Data (% change from 2000):
White: 41.54% (-14.40%)
Hispanic or Latino: 33.19% (+11.07%)
Other race: 24.09% (+14.86%)
Black or African American: 16.43% (+6.68%)
Asian: 6.88% (-0.52%)
Two or more races: 4.82% (-2.15%)
American Indian: 0.14% (-0.79%)
Native Hawaiian / Other Pacific Islander: 0.12% (-0.28%)
Housing Units: 30,116 (2000 Census)
Land Area: 26.9482 square miles
Water Area: 0.6318 square miles
Most populous zip code: 94509
|
 |

|
All zip codes:
94509, 94531(zip codes with population are shown in bold)Cities & Towns nearby Antioch
Oakley, CA 4.6mi E
Pittsburg, CA 5.2mi WNWBrentwood, CA 6.4mi SE
Knightsen, CA 7.6mi ESE
Clayton, CA 8mi WSW
Bay Point, CA 8.7mi WNW
Bethel Island, CA 9.7mi ENE
Concord, CA 11.7mi WBirds Landing, CA 11.8mi N
Byron, CA 12.2mi SE
Population data by age, 2005 dataUnder 5 years: 8,227 (7.96%)
5 to 9 years: 8,031 (7.77%)
10 to 14 years: 10,173 (9.84%)
15 to 19 years: 9,604 (9.29%)
20 to 24 years: 8,323 (8.05%)
25 to 34 years: 12,615 (12.21%)
35 to 44 years: 17,779 (17.20%)
45 to 54 years: 15,204 (14.71%)
55 to 59 years: 4,446 (4.30%)
60 to 64 years: 3,343 (3.23%)
65 to 74 years: 2,869 (2.78%)
75 to 84 years: 2,336 (2.26%)
85 years and over: 389 (0.38%)
Median age: 30.40 yearsPopulation data by age, legal ages, 2005 data18 years and over: 70,639 (68.36%)
21 years and over: 65,495 (63.38%)
62 years and over: 6,888 (6.67%)
65 years and over: 5,594 (5.41%)
18 years and older by gender, 2005 data18 years and over: 70,639 (68.36%)
Male: 35,460 (50.20% of this group)
Female: 35,179 (49.80% of this group)
65 years and older by gender, 2005 data65 years and over: 5,594 (5.41%)
Male: 2,351 (42.03% of this group)
Female: 3,243 (57.97% of this group)
Races, 2005 dataOne Race: 98,362 (95.18%)
Two or more Races: 4,977 (4.82%)
White: 42,930 (41.54%)
Hispanic or Latino (of any race): 34,301 (33.19%)
Black or African American: 16,981 (16.43%)
Asian: 7,108 (6.88%)
Native Hawaiian and Other Pacific Islander: 124 (0.12%)
American Indian and Alaska Native: 140 (0.14%)
Some other race: 24,895 (24.09%)
Hispanic or Latino Races, 2005 dataHispanic or Latino (of any race): 34,301 (33.19%)
Two or More Races, 2005 dataTwo or more Races: 4,977 (4.82%)
Two races including Some other race: 133 (0.13%)
Two races excluding Some other race, and Three or more races: 2,379 (2.30%)
Housedold Data, 2005 dataHousehold population: 103,339 (100.00%)
Householder: 33,976 (32.88%)
Spouse: 19,414 (18.79%)
Child: 35,695 (34.54%)
Other relatives: 9,526 (9.22%)
Nonrelatives: 4,728 (4.58%)
Unmarried partner: 1,778 (1.72%)
Total households: 32,575 Family households (families): 24,548 (75.36%)
With own children under 18 years: 12,909 (39.63%)
Married-couple families: 18,715 (57.45%)
With own children under 18 years: 9,746 (29.92%)
Male householder, no wife present: 2,227 (6.84%)
With own children under 18 years: 810 (2.49%)
Female householder, no husband present: 3,606 (11.07%)
With own children under 18 years: 2,353 (7.22%)
Nonfamily households: 8,027 (24.64%)
Householder living alone: 6,339 (19.46%)
65 years and over: 1,579 (4.85%)
Households with one or more people under 18 years: 14,760 (45.31%)
Households with one or more people 65 years and over: 4,538 (13.93%)
Average household size : 3.17
Average family size: 3.68
US Beacon Home